August 16, 2016 – Today, Lisa Ventriss, President of Vermont Business Roundtable (VBR) and Jeffrey Carr, President, Economic & Policy Resources (EPR), announced the Q3 2016 results of their joint initiative, the VBR-EPR Business Conditions Survey.
Methodology
The quarterly survey provides both a look back at the previous quarter and a predictive index going forward. The data for both the backward and forward-looking questions are weighted to the Vermont economy by sector employment and turned into “diffusion indices”.[1] These diffusion indices provide a tool for analyzing and presenting insight into the Vermont economy over time through the sentiments of the Roundtable members. The survey asked eight retrospective and prospective questions about the CEOs’ economic outlook, demand, capital spending, and employment.
Overall Findings
The latest survey, which was conducted during the first two weeks of July 2016, achieved a response rate of 69 percent overall and included a 50 percent or greater response rate from all but three sectors within the membership. Survey results show that:
- A majority of responses to the question about the state’s overall business climate outlook were neutral (58%). The remaining responses were split between optimistic (22%) and pessimistic (20%).
- More than 60 percent of respondents (61%) shared negative outlooks specifically with ease of hiring for available positions; and,
- The accommodations sector had the most optimistic outlook on the general business climate, while the utilities sector had the least optimistic outlook.
The raw (unweighted) survey data was easily compared to the quarterly, national Business Roundtable CEO Survey of national and multi-national companies, which contains similar questions to the VBR/EPR Survey in terms of employment and capital spending (www.brt.org). Comparing these two surveys revealed that
- Vermont companies are predicting slightly lower capital spending plans, but a more positive employment outlook than their national counterparts.
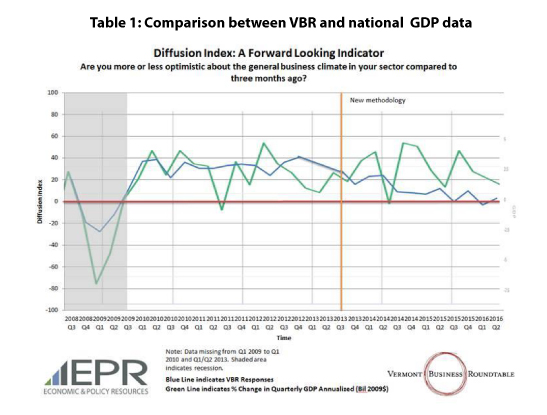
When comparing VBR/EPR survey results against national GDP data (Table 1), we find that
- Vermont’s outlook, though slightly improved from the previous survey, continues to lag behind actual economic activity.
Also included in the survey was the opportunity for Roundtable members to express their opinions on other topics adversely affecting their businesses, which showed that
- The greatest frequency of critical responses concerned difficulty of finding qualified employees, property taxes/high taxes, health care costs, and economic growth/development in Vermont.
The next survey will be conducted in early October 2016.
The Vermont Business Roundtable (VBR) is a nonprofit, nonpartisan organization of chief executive officers of Vermont’s leading private and nonprofit employers, representing geographic diversity and all major sectors of the Vermont economy. The Roundtable is committed to sustaining a sound economy and preserving Vermont’s unique quality of life by studying and making recommendations on statewide public policy issues. Learn more at www.vtroundtable.org.
Economic & Policy Resources, Inc. (EPR) has been providing private and public sector clients throughout the U.S. and Canada with problem-solving economic research and analysis services for more than 25 years. Our professionals bring a broad spectrum and a deep reservoir of problem-solving knowledge and experience in applied economics to each assignment. We put our capabilities and experience to work for our clients so that they have the insight and understanding necessary to move forward with confidence. EPR has successfully completed assignments throughout the United States and in eastern Canada. Learn more at www.epreconomics.com
1 Each question on the survey is weighted by sector employment and the diffusion number is formulated by giving each “strong positive” answer a numerical value of 1.0, “mild positive” answers a numerical value of 0.5, neutral answers a value of 0, “mild negative” answers a value of -0.5, and strong negative values of -1.0. The diffusion index numbers are then formulated based on these numerical values. A value of 100 would mean that every respondent answered “strong positive”, a value of 0 would mean that every respondent answered neutrally, and a value of -100 would mean that every respondent answered “strong negatively.”